散点图是常见的统计图表,图中散点的坐标用两个或三个数值型变量定义。如果有多个分组,可以用不同颜色、类型、大小的标记进行区分,或者分面表示。散点图可以用于探查变量之间的相关关系。[大谦Excel,dqexcel点com]
二维散点图
二维散点图常用于原始数据的探查和描述,或者查看两个数值型变量的相关关系。残差散点图常用于判断回归分析等统计分析的效果好坏。本小节介绍二维简单散点图和复合散点图的绘制。
简单散点图如图4-19所示。绘制简单散点图需要指定两组数据,一组数据表示数据点的x坐标,另外一组数据表示数据点的y坐标。

图4-19 散点图
复合散点图如图4-20所示,图中用多组简单散点图表示多组数据。绘制复合散点图需要为每组简单散点图指定两组数据,一组数据表示数据点的x坐标,另外一组数据表示数据点的y坐标。
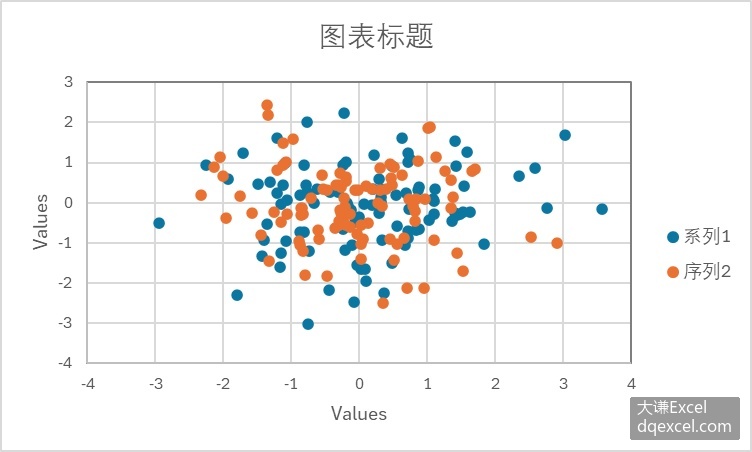
图4-20 复合散点图
抖动散点图
用具有共同分类的一组数据绘制散点图时,在不抖动的情况下,分组数据点沿一条竖线展布,它们具有相同的x坐标,如图4-21所示。其中有些位置上有重复的点。

图4-21 没有抖动的散点图
编写Python xlwings代码,绘制不抖动的散点图。完整代码见:Samples->ch07 数值型图表->15 抖动散点图-没抖动->py.py。
Sub Test()
  '省略部分代码

  Dim dblRD(1 To 20) As Double
  Dim dblY(1 To 20) As Double
  Dim intI As Integer
  Dim intJ As Integer
  For intI = 1 To 4
    cht.SeriesCollection.NewSeries
    For intJ = 1 To 20
      dblRD(intJ) = intI
      dblY(intJ) = Data(intJ, intI)
    Next
    cht.FullSeriesCollection(intI).XValues = dblRD
    cht.FullSeriesCollection(intI).Values = dblY
  Next
  cht.SeriesCollection.NewSeries
  Dim intN As Integer
  intN = cht.SeriesCollection.Count
  cht.FullSeriesCollection(intN).ChartType = xlXYScatterLinesNoMarkers
  cht.FullSeriesCollection(intN).XValues = Array(0.5, 4.5)
  cht.FullSeriesCollection(intN).Values = Array(0, 0)
  cht.FullSeriesCollection(intN).Format.Line.ForeColor.RGB = RGB(0, 0, 0)
  cht.FullSeriesCollection(intN).Format.Line.Weight = 1
End Sub
运行代码生成图4-21。
同一分类的数据点绘制成散点时呈直线展布,数据点大量重叠。为了表示这些重复的点,将它们在横向上在指定范围内进行抖动。如果是随机抖动,得到的散点图称为抖动散点图,如图4-22所示。

图4-22 抖动散点图
编写Python xlwings代码,绘制抖动的散点图。各组数据点在其x坐标轴线两侧w/2范围内随机抖动,y坐标不变。其中,w表示抖动宽度。完整代码见:Samples->ch07 数值型图表->16 抖动散点图-已抖动->py.py。
Sub Test()
  '省略部分代码

  Dim dblRD(1 To 20) As Double
  Dim dblY(1 To 20) As Double
  Dim intI As Integer
  Dim intJ As Integer
  For intI = 1 To 4
    cht.SeriesCollection.NewSeries
    For intJ = 1 To 20
      Randomize
      dblRD(intJ) = intI - 1 + 0.75 + 0.5 * Rnd
      dblY(intJ) = Data(intJ, intI)
    Next
    cht.FullSeriesCollection(intI).XValues = dblRD
    cht.FullSeriesCollection(intI).Values = dblY
  Next
   cht.SeriesCollection.NewSeries
  Dim intN As Integer
  intN = cht.SeriesCollection.Count
  cht.FullSeriesCollection(intN).ChartType = xlXYScatterLinesNoMarkers
  cht.FullSeriesCollection(intN).XValues = Array(0.5, 4.5)
  cht.FullSeriesCollection(intN).Values = Array(0, 0)
  cht.FullSeriesCollection(intN).Format.Line.ForeColor.RGB = RGB(0, 0, 0)
  cht.FullSeriesCollection(intN).Format.Line.Weight = 1
End Sub
运行代码生成类似图4-22的抖动散点图。
图4-23绘制水平方向的抖动散点图。
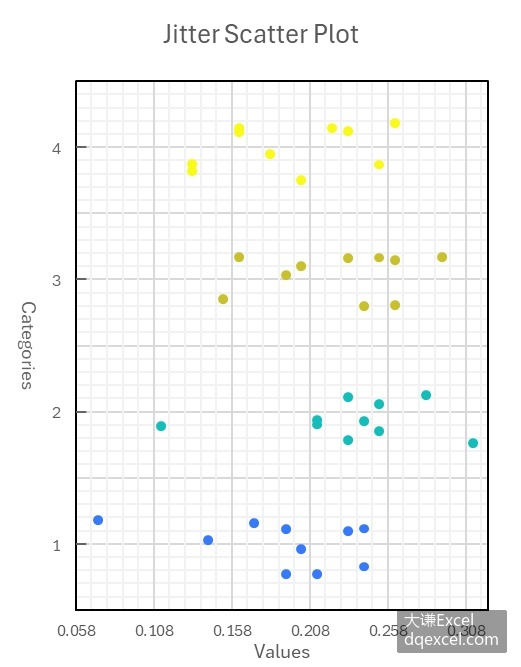
图4-23 水平抖动散点图
编写Python xlwings代码,绘制抖动的散点图。各组数据点在其y坐标轴线两侧w/2范围内随机抖动,x坐标不变。其中,w表示抖动宽度。完整代码见:Samples->ch07 数值型图表->17 抖动散点图-已抖动-横向->py.py。
Sub Test()
  '省略部分代码

  Dim dblRD(1 To 20) As Double
  Dim dblY(1 To 20) As Double
  Dim intI As Integer
  Dim intJ As Integer
  For intI = 1 To 4
    cht.SeriesCollection.NewSeries
    For intJ = 1 To 20
      Randomize
      dblRD(intJ) = intI - 1 + 0.75 + 0.5 * Rnd
      dblY(intJ) = Data(intJ, intI)
    Next
    cht.FullSeriesCollection(intI).Values = dblRD
    cht.FullSeriesCollection(intI).XValues = dblY
  Next
  cht.SeriesCollection.NewSeries
  Dim intN As Integer
  intN = cht.SeriesCollection.Count
  cht.SeriesCollection(intN).ChartType = xlXYScatterLinesNoMarkers
  cht.SeriesCollection(intN).XValues = Array(0, 0.35)
  cht.SeriesCollection(intN).Values = Array(0.5, 0.5)
  cht.SeriesCollection(intN).Format.Line.ForeColor.RGB = RGB(0, 0, 0)
  cht.SeriesCollection(intN).Format.Line.Weight = 1
End Sub
运行代码生成类似图4-23的抖动散点图。
规则散点图
图4-24称为规则散点图,它与普通二维散点图的根本区别在于,它是根据分类变量的数据绘制散点图,而普通散点图的两个坐标轴都是数值轴。如图4-24所示,该图在规则网格的节点上绘制散点,可以指定变量定义散点的颜色和大小。颜色通过变量的值映射颜色查找表进行获取。
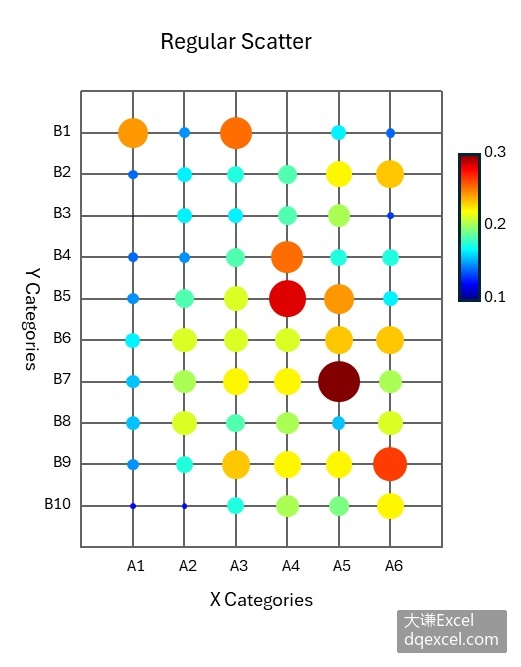
图4-24 规则散点图
用Python xlwings自己编程绘制规则散点图,绘制网格,根据数据大小在网格节点处绘制相应大小和颜色的圆形区域。本例使用了颜色查找表进行着色,相关内容请参见第4章。完整代码见:Samples->ch07 数值型图表->18 规则散点图->py.py。
Sub Test()
  '省略部分代码

  Dim data()
  Dim data2(1 To 8, 1 To 5) As Double
  Dim data3(1 To 8, 1 To 5) As Double
  data = ActiveSheet.Range("B2:F9").Value
  Dim minV As Double
  Dim maxV As Double
  Dim difV As Double
  minV = 1000
  maxV = -1000
  For intI = 1 To 8
    For intJ = 1 To 5
      If minV > data(intI, intJ) Then minV = data(intI, intJ)
      If maxV < data(intI, intJ) Then maxV = data(intI, intJ)
    Next
  Next
  difV = maxV - minV
  For intI = 1 To 8
    For intJ = 1 To 5
      data2(intI, intJ) = (data(intI, intJ) - minV) / difV
    Next
  Next
  For intI = 1 To 8
    For intJ = 1 To 5
      data3(intI, intJ) = data2(8 - intI + 1, intJ)
    Next
  Next
  Dim cm()
  cm = ActiveWorkbook.Sheets(2).Range("A1:C256").Value
  Dim sx1 As Double
  Dim sy1 As Double
  Dim sx2 As Double
  Dim sy2 As Double
  Dim shp1 As Shape
  Dim shp2 As Shape
  Dim shp3 As Shape
  For intI = 0 To 6
    For intJ = 0 To 9
      sx1 = ShapeX(cht, intI)
      sy1 = ShapeY(cht, 0)
      sx2 = ShapeX(cht, intI)
      sy2 = ShapeY(cht, intJ)
      Set shp1 = cht.Shapes.AddLine(sx1, sy1, sx2, sy2)
      shp1.Line.ForeColor.RGB = RGB(0, 0, 0)
      shp1.Line.Weight = 1
      sx1 = ShapeX(cht, 0)
      sy1 = ShapeY(cht, intJ)
      sx2 = ShapeX(cht, intI)
      sy2 = ShapeY(cht, intJ)
      Set shp2 = cht.Shapes.AddLine(sx1, sy1, sx2, sy2)
      shp2.Line.ForeColor.RGB = RGB(0, 0, 0)
      shp2.Line.Weight = 1
    Next
  Next
  Dim w As Double
  Dim w2 As Double
  Dim mg As Double
  Dim lf As Double
  Dim tp As Double
  Dim wd As Double
  Dim ht As Double
  Dim intR As Integer
  Dim intG As Integer
  Dim intB As Integer
  For intI = 1 To 5
    For intJ = 8 To 1 Step -1
      w = data3(intJ, intI)
      If Int(w * 256) = 0 Then
        Count = 1
        intR = cm(1, 1)
        intG = cm(1, 2)
        intB = cm(1, 3)
      Else
        Count = Int(w * 256)
        intR = cm(Count, 1)
        intG = cm(Count, 2)
        intB = cm(Count, 3)
      End If

      lf = ShapeX(cht, intI - w / 2)
      tp = ShapeY(cht, intJ + w / 2)
      wd = cht.PlotArea.InsideWidth / (cht.Axes(1).MaximumScale - cht.Axes(1).MinimumScale) * w
      ht = cht.PlotArea.InsideHeight / (cht.Axes(2).MaximumScale - cht.Axes(2).MinimumScale) * w
      Set shp3 = cht.Shapes.AddShape(9, lf, tp, wd, ht)
      shp3.Fill.ForeColor.RGB = RGB(intR, intG, intB)
      shp3.Line.Visible = False
    Next
  Next
  Dim shp4 As Shape
  lf = ShapeX(cht, 6.5)
  tp = ShapeY(cht, 8)
  wd = cht.PlotArea.InsideWidth / (cht.Axes(1).MaximumScale - cht.Axes(1).MinimumScale) * 0.4
  ht = cht.PlotArea.InsideHeight / (cht.Axes(2).MaximumScale - cht.Axes(2).MinimumScale) * 3
  Set shp4 = cht.Shapes.AddShape(msoShapeRectangle, lf, tp, wd, ht)
  With shp4.Fill
    .ForeColor.RGB = RGB(128, 0, 0)
    .OneColorGradient msoGradientHorizontal, 1, 1
    .GradientStops.Insert RGB(255, 0, 0), 0.1
    .GradientStops.Delete(2)
    .GradientStops.Insert RGB(255, 255, 0), 0.38
    .GradientStops.Insert RGB(0, 255, 255), 0.63
    .GradientStops.Insert RGB(0, 0, 255), 0.88
    .GradientStops.Insert RGB(0, 51, 255), 1
  End With
  Dim shp5 As Shape
  Dim cmLabelPos(1 To 3) As Double
  Dim cmLabels(1 To 3) As Double
  cmLabelPos(1) = 8.2
  cmLabelPos(2) = 6.9
  cmLabelPos(3) = 5.3
  cmLabels(1) = maxV
  cmLabels(2) = (maxV + minV) / 2
  cmLabels(3) = minV
  For intI = 1 To 3
    lf = ShapeX(cht, 8)
    tp = ShapeY(cht, cmLabelPos(intI))
    wd = cht.PlotArea.InsideWidth / (cht.Axes(1).MaximumScale - cht.Axes(1).MinimumScale) * 1.6
    ht = cht.PlotArea.InsideHeight / (cht.Axes(2).MaximumScale - cht.Axes(2).MinimumScale) * 0.6
    Set shp5 = cht.Shapes.AddLabel(msoTextOrientationHorizontal, lf, tp, wd, ht)
    shp5.TextFrame2.TextRange.Characters.Text = Format(CStr(cmLabels(intI)), "0.00")
    shp5.TextFrame2.TextRange.Characters.Font.Size = 8
    shp5.TextFrame2.AutoSize = msoAutoSizeTextToFitShape
  Next
  Dim shp6 As Shape
  Dim tk1LabelPos(1 To 9) As Double
  Dim tk1Labels(1 To 9) As Double
  For intI = 1 To 9
    tk1LabelPos(intI) = 9 - intI + 1
  Next
  For intI = 1 To 9
    tk1Labels(intI) = intI
  Next
  For intI = 1 To 9
    lf = ShapeX(cht, -0.6)
    tp = ShapeY(cht, tk1LabelPos(intI) - 0.2)
    wd = cht.PlotArea.InsideWidth / (cht.Axes(1).MaximumScale - cht.Axes(1).MinimumScale) * 1.5
    ht = cht.PlotArea.InsideHeight / (cht.Axes(2).MaximumScale - cht.Axes(2).MinimumScale) * 0.4
    Set shp6 = cht.Shapes.AddLabel(msoTextOrientationHorizontal, lf, tp, wd, ht)
    shp6.TextFrame2.TextRange.Characters.Text = Format(CStr(tk1Labels(intI)), "0")
    shp6.TextFrame2.TextRange.Characters.Font.Size = 8
    shp6.TextFrame2.AutoSize = msoAutoSizeTextToFitShape
  Next
  Dim shp7 As Shape
  Dim tk2LabelPos(1 To 9) As Double
  Dim tk2Labels(1 To 9) As Double
  For intI = 0 To 5
    tk2LabelPos(intI + 1) = intI
  Next
  For intI = 1 To 6
    tk2Labels(intI) = intI
  Next
  For intI = 1 To 6
    lf = ShapeX(cht, tk2LabelPos(intI) + 0.2)
    tp = ShapeY(cht, -0.07)
    wd = cht.PlotArea.InsideWidth / (cht.Axes(1).MaximumScale - cht.Axes(1).MinimumScale) * 1.5
    ht = cht.PlotArea.InsideHeight / (cht.Axes(2).MaximumScale - cht.Axes(2).MinimumScale) * 0.4
    Set shp7 = cht.Shapes.AddLabel(msoTextOrientationHorizontal, lf, tp, wd, ht)
    shp7.TextFrame2.TextRange.Characters.Text = Format(CStr(tk2Labels(intI)), "0")
    shp7.TextFrame2.TextRange.Characters.Font.Size = 8
    shp7.TextFrame2.AutoSize = msoAutoSizeTextToFitShape
  Next
  Dim shp8 As Shape
  lf = ShapeX(cht, 1.8)
  tp = ShapeY(cht, -0.5)
  wd = cht.PlotArea.InsideWidth / (cht.Axes(1).MaximumScale - cht.Axes(1).MinimumScale) * 2.5
  ht = cht.PlotArea.InsideHeight / (cht.Axes(2).MaximumScale - cht.Axes(2).MinimumScale) * 0.6
  Set shp8 = cht.Shapes.AddLabel(msoTextOrientationHorizontal, lf, tp, wd, ht)
  shp8.TextFrame2.TextRange.Characters.Text = "X Axis Label"
  shp8.TextFrame2.TextRange.Characters.Font.Size = 10
  shp8.TextFrame2.AutoSize = msoAutoSizeTextToFitShape
  Dim shp9 As Shape
  lf = ShapeX(cht, -0.9)
  tp = ShapeY(cht, 5.5)
  wd = cht.PlotArea.InsideWidth / (cht.Axes(1).MaximumScale - cht.Axes(1).MinimumScale) * 0.6
  ht = cht.PlotArea.InsideHeight / (cht.Axes(2).MaximumScale - cht.Axes(2).MinimumScale) * 2.5
  Set shp9 = cht.Shapes.AddLabel(msoTextOrientationVertical, lf, tp, wd, ht)
  shp9.TextFrame2.TextRange.Characters.Text = "Y Axis Label"
  shp9.TextFrame2.TextRange.Characters.Font.Size = 10
  shp9.TextFrame2.AutoSize = msoAutoSizeTextToFitShape
End Sub
运行代码生成类似图4-24的规则散点图。[大谦Excel,dqexcel点com]